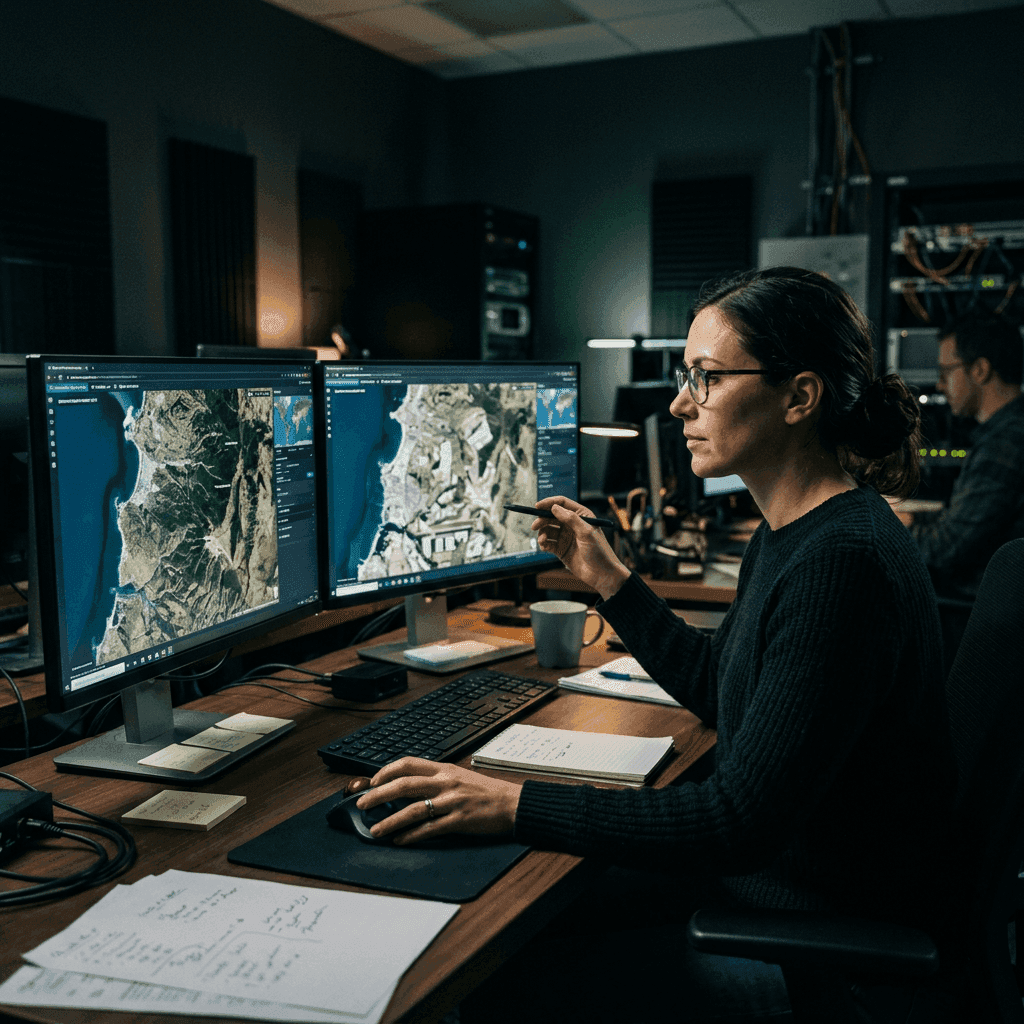
The best underwriting data is 500 km up.
Insurers and risk analysts are discovering that orbital observation gives them independent, current ground truth on the exposures they price, from disaster hazards to civil infrastructure.
You are pricing risk you cannot see
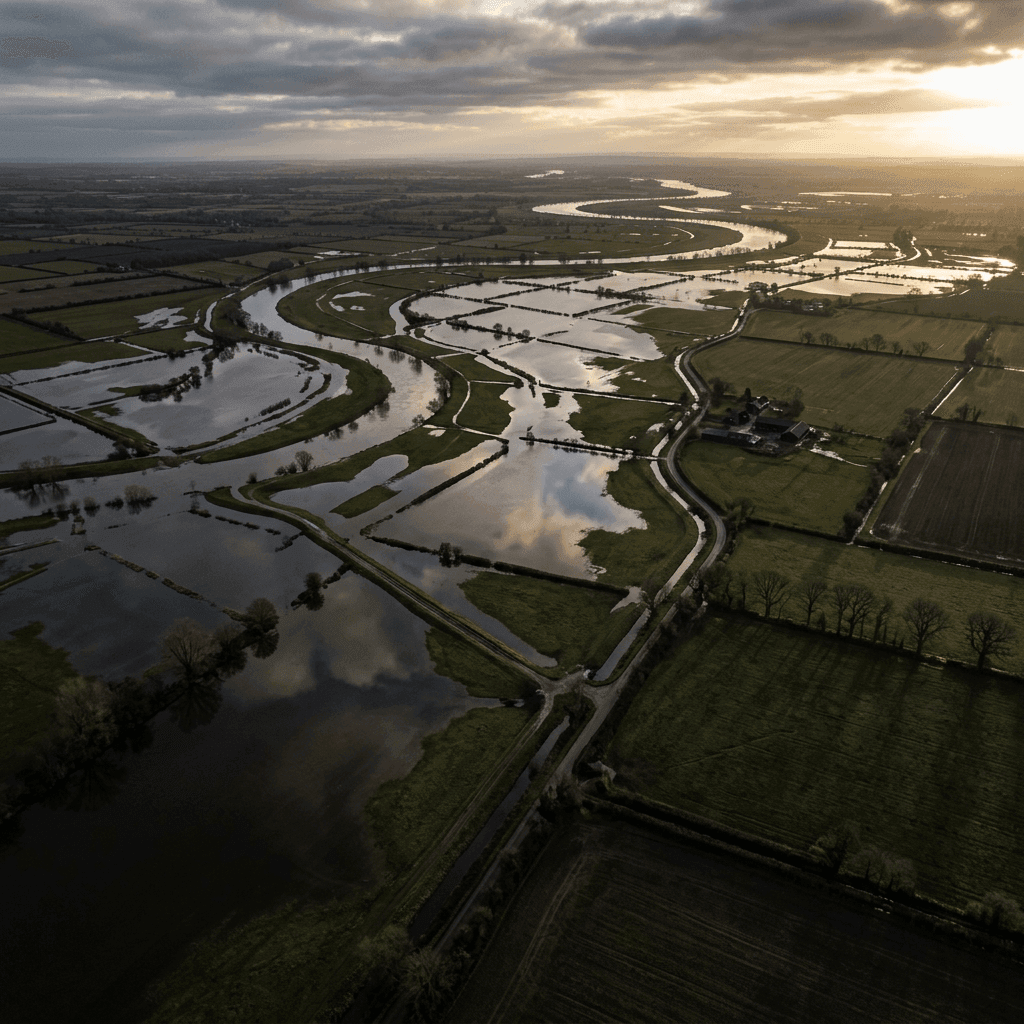
Every insurer and risk analyst works from a picture of the world that is, to some degree, out of date. Exposure data is filed by clients, aggregated from public records and stitched together from surveys that were true when they were taken and drift further from reality every quarter. When a cyclone forms, a river floods or a coastline shifts, the underwriter often learns the consequences after the loss, not before the renewal. The gap between what is on the books and what is on the ground is where portfolios quietly accumulate risk nobody priced.
The commercial problem is not a shortage of models. It is a shortage of independent, current ground truth to feed them. A model is only as good as the observations behind it, and the observations that matter most (where hazards are building, how exposures are actually distributed, what changed since the last survey) are exactly the ones that are hardest to gather at scale and hardest to trust when they arrive from an interested party.
Orbit changes the economics of that problem. A satellite does not care whose exposure it is imaging or whether a client filed accurately. It sees the ground as it is, on a cadence no survey can match, over areas no field team can cover. For an insurer or an analytics firm, that is not a curiosity. It is a source of underwriting and monitoring data that is independent by construction.
Ground truth, tasked to your questions
The core of that capability is Earth observation itself. Observation satellites provide electro-optical and radar imagery, change detection and derived intelligence, tasked to the questions that matter to the buyer rather than filtered through someone else's priorities. Radar sensing in particular is what makes the data dependable for risk work: it images through cloud and at night, so a hazard building under a storm system is still visible when optical imagery would show nothing but weather.
Change detection is where the underwriting value concentrates. What matters to a portfolio is rarely a single snapshot; it is the difference between now and the last observation: the new construction inside a flood plain, the coastal erosion approaching an insured asset, the land-use shift that quietly moved an exposure into a higher hazard band. Imagery tasked and compared over time turns a static exposure file into a monitored one.
The commercial advantage of independent sourcing runs deeper than data quality. Observation tasked on your priorities, from a non-aligned origin, is data an insurer can build a product on without discovering later that access depends on a foreign government's willingness to keep sharing. For a risk business, that continuity is the difference between a feature and a foundation.
Hazards, watched as they happen
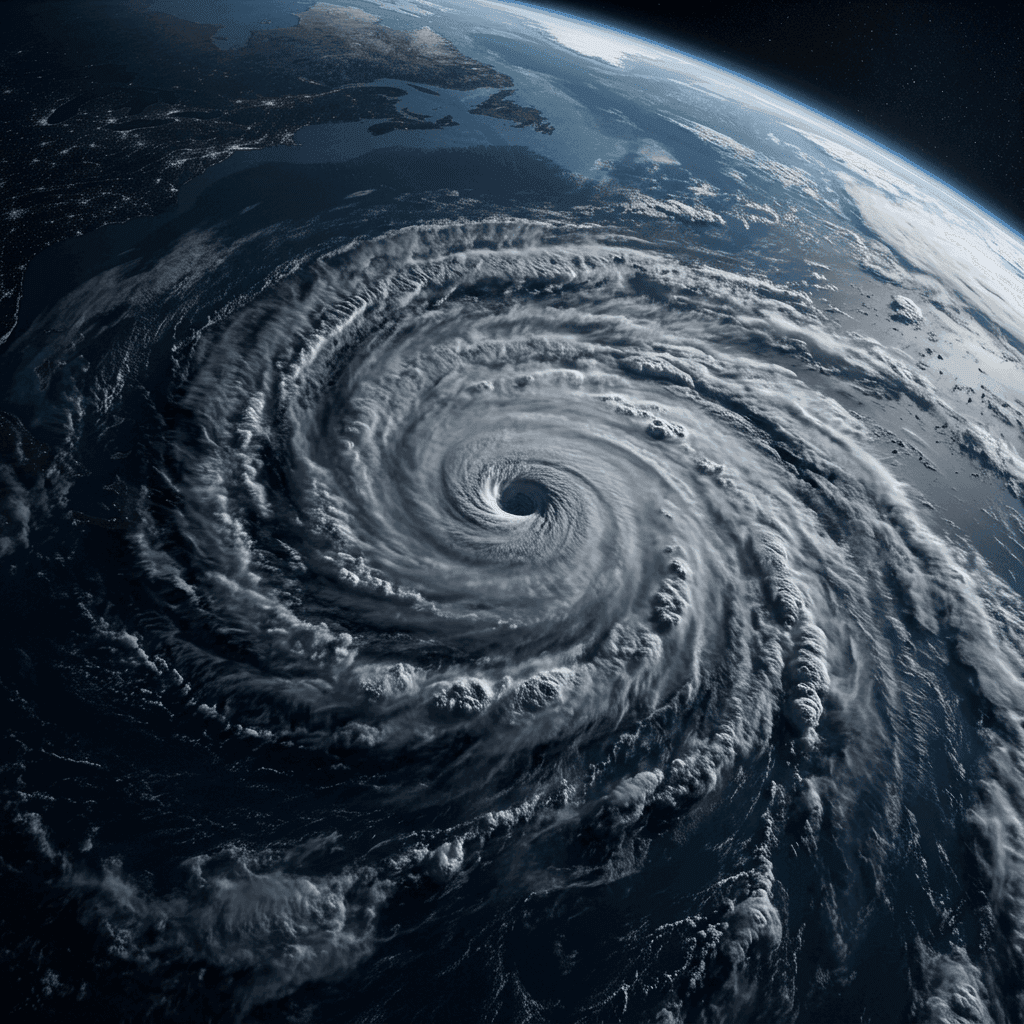
Underwriting is only half the cycle. The other half is what happens when an event is actually unfolding, and here the picture has to be live. Disaster-risk monitoring delivers a real-time operating picture of cyclones, flooding and coastal hazards, built from earth-observation and ground data, and it is designed from the outset to serve insurers alongside authorities and citizens. For a carrier, that means seeing an event develop across a portfolio's geography rather than reconstructing it from claims after the fact.
The value shows up at both ends of an event. Before it lands, a live hazard picture buys time: to model likely loss, to warn insureds, to pre-position response. After it passes, the same picture supports faster, better-founded claims handling, because the extent and severity of a flood or storm are observed rather than argued. That is decision support across the preparation, response and recovery phases, drawn from one picture rather than assembled from scattered reports.
For an analytics firm building products for the insurance market, hazard monitoring is a natural extension of the observation layer: the same orbital and ground data, turned from a static exposure view into a dynamic hazard feed. It comes from the data-science team behind the fisheries platforms, applying earth observation to public safety, which means the pedigree behind the hazard picture is proven analytics rather than a repackaged data feed.
One investment, many books of business
The reach of orbital data extends well beyond any single line of business, and that breadth is itself commercially significant. Civil space applications are drawn from a solutions atlas of 734 applications across 16 sectors: border monitoring, disaster response, energy infrastructure, urban planning and more. For an insurer or analytics firm, that catalogue is a map of adjacent products: the same underlying infrastructure that informs a property book can feed an energy-infrastructure line, an agricultural product or an urban-development risk model.
That matters because space capability is capital-intensive, and the return improves sharply when one investment serves many uses. A firm that builds its analytics on orbital observation is not buying a single-purpose feed; it is buying an infrastructure that expands the set of risks it can credibly price. The civil-applications catalogue is what turns a defence-grade observation capability into a broad commercial asset.
Unstrat brings these capabilities together as an independent, non-aligned channel, one accountable route from first briefing through delivery, with the data tasked on the buyer's priorities and no obligation to any major power. For a risk business, that is the quiet advantage: underwriting data that is current, independent and yours to build on. The best ground truth an underwriter can buy is no longer on the ground at all.